Education is in good hands: SASFE17

DAQVmNDXYAAlqH8It seems an age has passed since Saturday when the second Forum on Education was held at St Albans School. Many ideas have been whizzing about my head since listening to the keynotes and popping in and out of the seminars (of course one of the great draw backs to organising a conference is not being able to attend sessions in full). The theme of Learning Relationships seemed to knit together the different topics on offer, with unusual perspectives giving a reminder of what is actually important for learners and teachers.


I would just like to take this opportunity to thank everyone present, delegates and speakers alike, for making the day so enjoyable to host. The conversations that flowed showed just how important it is to take time to reflect on and discuss what we do, emphasising keynote speaker Mike Grenier’s focus on slow education. The fact that all of the speakers were teachers, actually at the coal face of education, brought an honesty that can be hard to mimic. Certainly my one big ‘takeaway’ from the day is that education is in good hands. It is an absolute pleasure to have helped set up the right DAQnpyEXsAAcxpzenvironment to enable us to come together. With huge thanks to the cleaners, porters, catering team and John in reprographics who all enabled the conference to go ahead. And I would single out Rob Hagon and Network Support for their hard work in allowing the IT to be invisible throughout the day.

The St Albans School Forum on Education 2017 has set a high bar and following the success of the day, we will be looking to host our third conference at a similar point in the Summer Term 2018. Once again tickets will be in limited supply to ensure we retain the intimate and small-scale atmosphere that makes SASFE so special. Watch out for updates in September and January!

DARhoWaWAAAiPRL

Are you looking for speakers at your next conference or teachmeet?

I would whole-heartedly recommend all of the following, arranged in alphabetical order.

  • Dr Jill Berry – closing the conference with her keynote on how leadership can be used to maintain and improve working relationships within a school.
  • Elizabeth Carr – explored the role of the subject in learning relationships and how to model history as a discipline.
  • Dawn Cox – discussed how whole school initiatives need to be fully focused on learning and linked to research in her seminar titled ‘Where’s the learning?’
  • Andy Ford and Tom Hockedy – a session that presented the progress of an Action Research Project at Berkhamsted School trying to answer the question ‘If the learning environment is more advanced, will it create more powerful learners?’
  • Mike Grenier – opening the conference with a keynote on how Slow Education can help develop learning relationships in a school.
  • Dr Greg Hacksley – joined by St Albans School Upper Sixth pupils Dan, Darcey, Josh and Paddy this session took a pupil’s-eye view of education to answer the question ‘How do I learn?’
  • Matt Pinkett – used a mixture of anecdotal evidence, personal experience and research to argue that there is a masculinity crisis in our schools with suggestions of what schools can do to address it head on.
  • David Rogers – discussed the concept of grit, detailing a long term project that aims to develop academic resilience to give pupils the qualitites and qualifications needed for academic success.
  • Professor Sophie Scott – her pre-lunch keynote discussed how laughter acts as an emotional regulator in relationships. As Victor Borge put it “laughter is the shortest distance between two people.”
  • Kevin Squibb – gave a quick introduction to Hattie’s idea of Visible Learning, leading to discussion of how to take create assessment capable learners.
  • Drew Thomson – examined the importance of relationships between colleagues and looked at how staff can maximise the impact of those around them.
  • Bukky Yusuf – spoke about key strategies to establish effective learning behaviours with disaffected pupils in her seminar titled ‘Challenging classes and the lessons I learnt.’

DARtN3AXYAEdr1S

Learning Relationships: SASFE17

Discussion

On Saturday 20th May St Albans School is holding its second education conference, this year exploring relationships in learning. The event is intentionally small in scale and refreshingly non-corporate, taking the best aspects of a TeachMeet and combining an overarching theme with dedicated time and space to driving conversations over refreshments, breaks and lunch (and perhaps even in the pub after the official event has ended). As a forum, the day works by actively giving delegates the opportunity to discuss themes from the keynotes and seminars on offer. This year the schedule has been tweaked to allow even more opportunities for talk and thought. The seminar sessions are workshops in the true sense of the word, allowing those present to contribute and drive the collective thought process. The hugely positive feedback from delegates at last year’s conference is shared at the bottom of this post.

Keynote speakers

The fabulous Professor Sophie Scott will be providing much merriment and mirth with the science of that most human interaction, comedy and humour. As deputy director of UCL’s institute of Cognitive Neuroscience her research interests include the neural basis of vocal communication and how our brains control the production of voice. Professor Scott’s TED talk on why we laugh has been viewed almost 2.5 million times.

Audience

Find out more about taking the time to develop learning and Slow Education, the antithesis of the McDonald’s production line, with keynote speaker Mike Grenier. Mike is an English teacher and Housemaster at Eton College and “one of the leading lights of the ‘Slow Education’ movement”.

Jill Berry
Jill at SASFE16

Dr Jill Berry is returning to SASFE following last year’s highly successful closing keynote. Author of the book Making the Leap and a preeminent consultant on leadership, she will be bringing her unique perspective to the day. As a former English Teacher, Head of Department and Head, Jill will be discussing the leadership of relationships with ideas that can be applied to the ‘leaders’ in every classroom of a school.

About the theme

The more I teach, the more convinced I am that relationships are key to successful outcomes. Human interactions are what makes education work and ultimately why we will not be replaced with machines. SASFE17 will help frame the discussion of what makes learning work on the level of relationships; come along and be a part of this discussion! It would be great to have you there on the day.Discussion 2

Why come along?

Don’t take my word for it… See the feedback from the St Albans School Forum on Education 2016!.

Feedback: What was your favourite aspect of the day?

“The whole thing was great, actually. Each speaker brought something quite different to the table…I enjoyed being able to take some ideas away from all sessions I attended – every single one gave me a practical idea to take away that I could implement or adapt. Importantly, they have all had an influence on my thinking and my approach; on my philosophy. I was really impressed actually!”

“There was a refreshing honesty about what we both know and don’t know about education. Speakers were engaging and clear.”

“Provided food for thought. Challenged my thinking and viewpoints.”

Martin Robinson

Martin Robinson, mid-keynote, opening the conference in 2016

“Practical suggestions directly related to my subject area”

“The ability to be in a smaller, intimate group.”

“The discussions which took place beyond the seminars”

“A combination of delivery, hands-on work in groups, discussion.”

Feedback: What was the most beneficial aspect of the event?

“As I so often find to be the case the most beneficial parts of this conference were those where the opportunity for discussion with staff from a variety of backgrounds/viewpoints was provided. In particular, I found the inclusion of a student in one of the discussions to be most thought provoking.”

“Networking and chance to discuss.”

“Well structured day. Sessions right length. Liked the 3 short keynotes. I liked the fact it was a relatively small crowd.”

“The opportunity to discuss with teachers from very different schools and backgrounds”

“Small groups meant you felt part of the event rather than simply a number”

“Meeting contacts old and new”

“The commonality of the speakers”

“Stimulating and challenging ideas to take away”

Ian Yorston

Ian Yorston giving his keynote on IT’s role in assessment at SASFE16

“The small group sessions and opportunity to share ideas”

“The combination of excellent workshops and keynotes with time for networking. It being small helped here. The day flew by!”

“An excellent opportunity to meet like-minded colleagues.”

“The small seminar style of options, with the opportunity to meet other teachers with similar interests and concerns.”

“Meeting other enthusiastic teachers and engaging in stimulating discussions.”

“Meeting enthusiastic teachers local to me, in all subjects and levels of management was really refreshing and motivating.”

Transcription Factors

Intracellular proteins that bind to specific regions of DNA to control transcription are known as transcription factors. Examples include:

  • PIF and DELLA proteins
  • Proteins coded by the regulatory genes of the lac operon
  • cAMP and the second messenger model
  • Products of proto-oncogenes and tumour suppressor genes

Gibberellin and DELLA proteins

DELLA proteins inhibit transcription by binding to a molecule known as PIF. This prevents PIF from transcribing DNA into mRNA. However, DELLA is broken down when the plant hormone gibberellin is present. The PIF is now free to join to the promoter on the DNA and start transcribing it into mRNA, which can then be translated by a ribosome.

In the case of wheat and barley seed germination, amylase is synthesised when the gibberellins destroy the DELLA proteins. This allows the starch in the endosperm of the seed to be broken down to provide a source of carbohydrate for respiration. E.g. the gibberellins turn on the gene for amylase production by destroying the DELLA proteins.

Glossary:

  • DELLA: proteins that inhibit the binding of transcription factors. Regulate amylase production in barley and wheat seeds.
  • Endosperm: tissue that provides a source of energy for the developing embryo of a seed.
  • Gibberellins: plant hormone that is involved in growth, germination and flowering.
  • Intracellular: within a cell, as opposed to extracellular meaning between cells.
  • lac operon: length of DNA found in E. coli that controls the expression of proteins involved in taking up and digesting lactose.
  • PIF: phtochrome-interacting protein, a transcription factor.
  • Proto-oncogenes and tumour suppressor genes: genes involved in the regulation of the cell cycle, growth and programmed cell death (apoptosis).
  • Second messenger model: a process involving intracellular signalling molecules, such as cyclic AMP, that are triggered by extracellular messengers, such as oestrogen.
  • Transcription: the production of mRNA from DNA.
  • Transcription factors: proteins that control the flow of information from DNA to RNA by controlling the formation of mRNA.
  • Translation: the production of a polypeptide by a ribosome from mRNA.

Biological Molecules: Lipids

There are two types of lipid of interest to an A level biologist: triglycerides and phospholipids. Both play important roles in living organisms.

Triglycerides

These are characterised by a glycerol molecule with three fatty acid ‘tails’. The bond between the glycerol and fatty acid is known as an ester bond and is formed by a condensation reaction where water is produced. Hydrolysis is the reverse process and used to digest triglycerides. This is very similar to condensation and hydrolysis of
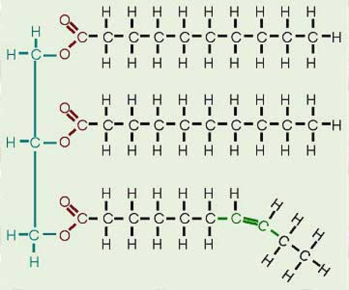
 carbohydrates. The actual structural formula of a triglyceride is shown below, with the glycerol molecule on the left. Note that the ester bonds are shown in a dark red colour. The top two fatty acids are said to be saturated as there are no double nods between the carbon atoms. Whereas the third fatty acid is unsaturated, due to the presence of a carbon-carbon double bond.

The formation of one triglyceride leads to three water molecules being produced, as there will be a condensation reaction between each fatty acid and the glycerol molecule. This is modelled in the diagram below:

triglyceride-formation

Triglycerides have several useful functions in organisms:

  • Energy reserve
  • Insulator
  • Buoyancy
  • Source of metabolic water

Phospholipids

Similarly to triglycerides, phospholipids are made of a glycerol molecule. They also have fatty acids, but only two with a phosphate group instead of the third. We describe the phosphate and glycerol as being the ‘head’ of the molecule, with the two fatty acids called ‘tails’. Ester bonds connect the glycerol to the phosphate and fatty acids.

As mentioned in the labels above, the head is polar and so hydrophilic, and the tail is hydrophobic. This causes phopholipids to arrange themselves as a bilayer when in water, allowing the heads to be in contact with water and the tails to be tucked away from the water. See diagram below modelling how a cell might form in water, with the phopholipids arranging themselves into a cell membrane. We will come back to phopholipids in the post about cell membranes.

Glossary

  • Condensation: a chemical reaction involving the joining together of two molecules by removal of a water molecule.
  • Ester bond: the chemical link, -COO-, between the carboxyl group (-COOH) of the fatty acid and hydroxyl group (-OH) of the glycerol.
  • Fatty acid: contain a carboxyl group (-COOH) with a long hydrocarbon tail, often 15-17 carbons long.
  • Glycerol: an alcohol with three hydroxyl groups (-OH)
  • Hydrophilic: water-loving.
  • Hydrolysis: a reaction in which a complex molecule is broken down to simpler ones, involving the addition of water.
  • Hydrophobic: water-hating.
  • Phospholipid: made up of a glycerol molecule, two fatty acids and a phosphate group. Forms the basic structure of all cell membranes.
  • Saturated fatty acid: a fatty acid with no carbon-carbon double bonds (C=C) in its hydrocarbon tail.
  • Triglyceride:
  • Unsaturated fatty acid: a fatty acid with at least one C=C (they are unsaturated because they do not contain the maximum possible amount of hydrogen atoms). Can be monounsaturated with just one C=C, or polyunsaturated with two or more C=C.


Biological Molecules: Carbohydrates

Carbohydrates are excellent examples of monomers and polymers. Their one unit monomers are known as monosaccharides. Some examples of monosaccharides include:

  • α-glucose
  • β-glucose
  • Galactose
  • Fructose

α-glucose and β-glucose are an example of a structural isomer, both have the same chemical formula, C6H12O6 but the atoms are arranged slightly differently.

alpha-glucose

alpha glucose

The diagram to the left shows the structural arrangement of atoms in α-glucose. Although not shown on the diagram, at each corner of the hexagon between the -H and -OH (or hydroxyl group) there is a carbon atom. These have been labelled clockwise as carbon number 1, carbon number 2 and so on. The only difference between α-glucose and β-glucose is the position of the -OH on carbon number 1. In α-glucose the hydroxyl group is below the plane of the ring, e.g. the H is above it. Whereas in β-glucose, the hydroxyl group is above the plane of the ring, e.g. the H is below it. One way of remembering this is by invoking the Swedish super group ABBA. Alpha (the -OH is) Below (carbon 1), Beta (the -OH is) Above (carbon 1). Hence ABBA, alpha below, beta above. The diagram below summarise this information.

alpha-v-beta-glucose

Disaccharides are made of two monosaccharides joined by a glycosidic bond. Three common disaccharides are shown below, along with the mononsaccharides that make them up.

  • Maltose, made from two α-glucose molecules
  • Sucrose, made from one α-glucose and one fructose molecule
  • Lactose, made from one α-glucose and one galactose molecule

During the reaction between two monosacchrides that results in a disaccharide, water is formed. Therefore we call it a condensation reaction. The process of making maltose is outlined in the diagram below:

condensation

The highlighted -H and -OH groups form the water and leave a -O- that joins the two monosaccharides, which is the glycosidic bond. The glycosidic bond’s precise position is between carbon number 1 on the left hand moecule and carbon number 4 on the right hand molecule, making a 1-4 glycosidic bond. The opposite of this process, e.g. splitting a disaccharide into two monosaccharides with the addition of water, is called hydrolysis.

In terms of a balanced chemical equation for condensation we show the following, note that the disaccharide has two fewer hydrogens and one fewer oxygen, which have formed the water.

C6H12O6 + C6H12O6 → C12H22O11 + H2O

Polysaccharides are carbohydrates with three or more monosaccharides joined together with glycosidic bonds. They are formed by condensation reactions and can be broken down by hydrolysis. Three common polysaccharides are:

Glycogen, a storage molecule found in animals made from α-glucose. Its highly branched and compact shape make it very well suited to this function. The diagram to the right represents this structure, with each circle representing α-glucose.

Starch, a storage molecule found in animals made from α-glucose. It is made up of linear chains of amylose and branched amylopectin chains. Starch is insoluble, meaning that it does not effect the water potential of the cells it is stored in, so does not effect osmosis.

Cellulose, a structural carbohydrate that makes up plant cells’ cell wall made from β-glucose. It forms straight chains that come together as microfibrils to support the cell.

If you would like to know more about how these polysaccharides form and where the glycosidic bonds are located see appendix (i).

We can test for the presence of reducing sugars (e.g. glucose), non-reducing sugars (e.g. sucrose) and starch with the following tests:

  • Test for reducing sugars – add sample to blue Benedict’s solution and heat above 80ºC / boil.  If reducing sugars are present, a red precipitate forms. Small amounts result in a green colour, going through yellow to orange to brick red.
  • Test for non-reducing sugars – first carry out the test for reducing sugars, but you will get a negative result (the Benedict’s solution remains blue). Then add dilute hyrdochloric acid to some of the original sample . Repeat the test for reducing sugars and you should get a positive result, e.g. it turn red.
  • Test for starch – add iodine solution to your sample. It should change colour from orange/brown to black/blue.

Glossary

  • Cellulose: polysaccharide that forms the cell wall in plants, made of β-glucose.
  • Condensation reaction: a chemical reaction involving the joining together of two molecules by removal of a water molecule.
  • Disaccharide: a sugar molecule consisting of two monosaccharides joined together by a glycosidic bond.
  • Glucose: a monosachharide that has two isomers, α-glucose and β-glucose.
  • Glycogen: a polysaccharide made of many glucose molecules linked together, that acts as a glucose store in liver and muscle cells.
  • Glycosidic bond: a C-O-C link between two monosaccharide molecules, formed by a condenstaion reaction.
  • Hyrdolysis: a reaction in which a complex molecule is broken down to simpler ones, involving the addition of water.
  • Hydroxyl group: a pair of atoms (O and H) found in carbohydrates and other molecules.
  • Monosaccharide: a molecule consisting of a single sugar unit with the general formula (CH2O)n.
  • Polysaccharide: a polymer whose subunits are monosaccharides joined together by glycosidic bonds.
  • Starch: polysaccharide found in most green plants as an energy store, formed from chains of amylose and amylopectin.

Appendix (i)

The formation of polysaccharides.

Cellulose forms 1-4 glycosidic bonds to make an unbranched chain, see below:

cellulose

Glycogen forms a mixture of 1-4 and 1-6 glycosidic bonds, hence the branching:

glycogen

The amylose in starch forms 1-4 glycosidic bonds, so is unbranched. However, the amylopectin branches are caused by 1-6 glycosidic bonds:

starch

EXTENDED IDEA: Children’s TV

When I was younger I quite wanted to be a Children’s TV presenter, a la Andy Peters or Philip Schofield. Things didn’t quite pan out that way, however, recently I have found myself starting to watch more and more Children’s TV shows. In this post I rank those that I have seen, giving a brief critique of each.

  1. Sarah and Duck: this is a totally wonderful programme. They lead a bit of a crazy life. But what Duck can do with just the narrowing of his eyes shows that dialogue can be greatly overrated and the animators are true masters of their craft. Supporting characters abound, all with well-developed back stories; Umbrella, Bug, The Shallots, Scooter Boy, Flamingo and John, Plate Girl, the Narrator, Bag Lady, Bag, Donkey, etc are all superb. But Cake takes the biscuit, his two episodes are genius. And the “It’s your birthday today” song has overtaken Happy Birthday in my estimation. Quite a feat! Wonderful entertainment from a young girl and her mallard.
  2. Thomas and Friends: a childhood favourite that has withstood a makeover without losing its charm. Always a good watch with plenty going on. Ok, Thomas is actually a bit of a loose cannon and pretty much every character has their faults (don’t we all?), but their desire to be a really useful engine is something we should all aspire to. FWIW, James is my favourite. I like his red paint and vainglorious ways. Similarly, Gordon’s phrase “it’s not wrong, we just don’t do it” has become a useful addition to my vocabulary when I really want to annoy someone. 
  3. Charlie and Lola: it’s always a pleasant experience watching this programme. Right from the theme music onwards it is spellbinding stuff. A feel good favourite.
  4. Fireman Sam: I thought I would hate this new rendering of an old classic, but it has won me over. Despite Sam’s head being ridiculously oversized, I can look past this anatomical-anomaly to enjoy the highjinx of Pontypandy. Special mention goes to Norman for being a one-boy accident zone, but who always sees the error of his ways and apologises in the end.
  5. The Adventures of Abney and Teal: two rag dolls living on an island in a lake in a city. Yet again the supporting characters enrich the programme to make the sum greater than its parts; Neap, the Poc Pocs, Bop and Toby Dog (please, please learn another tune!) all add a sense of whimsical fancy.
  6. Nelly and Nora: two Irish youngsters living the fun life in a caravan park. Another whimsy that is wholesome and good.
  7. In the Night Garden: this is another crazy show. One thing I cannot unsee is Iggle Piggle resembling former Prime Minister, David Cameron. The Pontypines are great fun (my father can’t stand them for some reason, interestingly he also has no time for the Pinky Ponk airship either) and spotting the Wottingers is a rare delight. Amazingly it apparently cost £14.5 million to produce 100 episodes. That seems a lot to me!
  8. My Family: (not the BBC sitcom) this gives the chance to gawp at the life of another family. It is a simple premise and one that works very well.
  9. Peppa Pig: this is like crack cocaine for the under fives. I’m not sure how the programme makers do it, but children seem to go absolutely nuts for it. Yes, Peppa is a bit bossy / naughty and the moral high-grounding can get a bit much after a while, but they’ve obviously found the recipe for success. And Mr Skinnylegs is such a good name for a spider.
  10. Baby Jake: I literally have no idea what is going on in this programme! This much I know, there’s a baby called Jake in it.
  11. My First: another Ronseal of a show, we watch a child experience their first [insert activity here]. An example, opening a bank account. A must for aspiring accountants everywhere.
  12. Bob the Builder: unlike Fireman Sam, this new imagining leaves me cold. Just hearing Bob drone on about his projects is enough to make me fall asleep. Pretty much every story involves one of the team screwing up a building job by ignoring the plan or disregarding instructions. Usually the miscreant is Scoop, a yellow digger, with a penchant for taking short cuts with dire consequences. The average episode starts with building something, someone ignore the plan, the thing they built falls down, the person who ignored the plan apologises, Bob says “never mind” and they build it again but this time properly. It’s a good job that Spin City seemingly has no other builders, because Bob’s crew are so incredibly inefficient and wasteful. I watch this programme in silent resignation. Dreadful.

I’m trying to be a little more innovative in my posts, see Extended ideas.

    EXTENDED IDEA: Sex and long-termism

    I’m trying to be a little more innovative in my posts, see Extended ideas.

    By sex, I mean male or female*. Apologies if the title has been clickbait to potentially something very different.

    Recently I have been thinking about sonographers and ultrasounds, specifically those undertaken in health authorities that allow pregnant women the chance to find out if their bump is a little boy or girl during the 20 week scan. While I am aware that such a practice always comes with the caveat that it is not 100% accurate, I wondered just how accurate it is. Does the sonographer keep a record of how many foetuses they correctly detail the sex of? Or are they just a point of prediction with no way of following up whether the information provided was correct? My thoughts are that they never actually find out whether they are right or wrong. Why would they unless they encounter the mother again?

    I wonder how many parents have an extra surprise on the arrival of their little bundle of joy? And what is the training in identifying the sex of foetuses? I might guess they use still and moving library images from 20 week scans (and dare say it would be easy to find out the exact details of the training, but that’s not quite the point of this extended-idea). It would be a very interesting experience to be expecting a girl and then finding you are welcoming a little boy into the world, or vice versa.

    My rather loose point is that it is sometimes very difficult to see how something one does actually turns out in the long run if there is no-one looking at outcomes much further down the line. Whether it’s the accuracy of determining sex of a foetus or anything else. For example, how do we actually know that anything a teacher does actually affects a pupil or class or year group? More importantly, what happens 5, 10, 20 years down the line? Do you produce “lifelong learners” or is it just a trendy thing to say? Longitudinal studies with regular follow ups can help identify trends or patterns, but are very much for the long-term. It seems to me too many people in education are concerned solely by the short-term. And don’t get me started on association football managers, the epitomy of short-termism! Seeing how things pan out isn’t necessarily the same as letting things drift, but perhaps this is the problem? More thinking (by me!) is required on this topic, but an interesting chain of thought nevertheless.

    *Last term I was asked to present to my school’s Diversity Society on sex and gender. A fascinating area, but for me sex is biological – due to chromosomes and therefore primary and, to some extent, secondary sexual characteristics – whereas I believe gender is a social-construct and inherently subjective.  However, chromosomal and developmental abnormalities is a topic to itself. As is gender and I am certainly open to interpretations that are non-binary. Both are perhaps best revisited in further detail in the future.

    Another book all Biology A level students should read

    This is a follow up to a post on essential reading for anyone who is taking Biology A level. In short, I have already listed (in no particular order) The Red Queen, The Immortal Life of Henrietta Lacks, Life Ascending, The Epigenetics Revolution and Darwin’s Island as books a Sixth Form biologist should read.

    Following the last post, a colleague and I debated the particular merits of each book and also the titles that were left out. The original was always meant to be the first in a series, so here I am with one more recommendation.

    The Selfish Gene by Richard Dawkins

    Perhaps the most controversial omission from the original post was Professor Richard Dawkins. To be quite frank, I would be more than happy to add any of his back catalogue to this list. The man is a real inspiration in terms of the ground-breaking work he so eloquently summarised in The Selfish Gene. Seeing organisms as “survival machines” for the genetic material that is inherited from parent to offspring is absolutely key to the kind of ‘big idea thinking’ required to truly understand the discipline. My 30th anniversary edition sits slightly battered on a shelf in my office, bought when I started teaching to replace the even more battered version I had at university.

    Dawkins’ gene’s eye view of evolution totally changes the focus of how we look at biology. Additionally, its style is accessible for pre-undergraduate students, although concentration and a sharp mind are useful to keep up with the witty and energetic prose. Don’t just take my word for it. Here’s what W D Hamilton, widely recognised as one of  most significant evolutionary theorists of the twentieth century, had to say:

    “This book should be read, can be read, by almost everyone. It describes with great skill a new face of the theory of evolution.”

    Still not convinced? Why not watch this short clip, The Selfish Gene Explained, from the Royal Institute to whet your appetite for the book. Following this, dive head first in to the book. Keep doing this and you will be amazed at just how much you can get from The Selfish Gene.  Just like the Necker cube mentioned in the preface to the second edition, you will see different perspectives on the theory of evolution via natural selection.

    CIE Biology: How to Ace Paper 3

    This post is specifically for the CIE Biology International A level qualification. What follows are my attempts to help guide students to do the best they can in the advanced practical skills exam, Paper 3. However, the information below is no substitute for proper revision and the dedicated practise of actually carrying out a variety of biology experiments. Additionally, I would strongly recommend you use the past papers section of CIE’s website to sit as many “mock” practical exams as possible.

    Command words in a question

    Describe:

    • Say what is going on, e.g. the trend or pattern of results.
    • When describing data, always use units if appropriate (e.g. °C or cm3).

    Explain:

    • Say why a trend or pattern is occurring.
    • When explaining data, always link it to A level Biology.

    Although describe and explain are the most common command words, you might find yourself answering questions with any of the following:

    • Calculate: use mathematics to find an answer. E.g. mean, percentage, percentage change, rate, ratio, etc.
    • Measure: use a suitable measuring instrument to take a reading, being sure to include units after the numerical answer.
    • Suggest: there is no one correct answer; you should look through the information you have been given for some clues.

    Even more rarely you might find one of the below command words in a question:

    • State: give a brief answer – maybe one word or a phrase.
    • Define: give a definition – these should be concise.
    • Determine: explain how you could take measurements and calculate an answer from these measurements (e.g. in an experiment).

    How many answers should I give?

    • If a question states “identify two” then only the first two responses will be marked.
    • If a question states “record observable differences” then all responses will be marked.

    How great is the risk?

    If a question asks you to “state the hazard with the greatest level of risk” for your practical, do not choose one you deem to be low risk. E.g. warm water in a thermostatically-controlled waterbath set at 30°C, is a hazard that is low risk and so would not gain a mark. A better answer would identify a risk that was either medium or high, e.g. hydrogen peroxide is harmful to the skin. The key is to identify a hazard with “the greatest level of risk”.

    Deciding independent variable values

    Give five values at roughly even intervals (e.g. every 5°C or 10 cm3) when deciding what values to use for your independent variable. Always use units if appropriate (e.g. °C or cm3).

    Recording numbers and drawing tables

    Do not go past one decimal place when recording the results from your experiment, usually whole numbers are fine. And always use units if appropriate (e.g. °C or cm3).

    Table Headings:

    • Put the independent variable (IV) on the left and dependent (DV) on the right.
    • Draw a line between the top row and the body of the table, e.g. underline the IV and DV.
    • Use the full name of the IV and DV (e.g. temperature of hydrogen peroxide and time taken to rise).
    • Only use units  in the headings, not the body of the table (e.g. temperature of hydrogen peroxide / °C and time taken to rise / s).

    table

    Results

    • Record results for at least five values of the IV.
    • Results should show the pattern or trend theoretically expected of the practical.
    • Use whole numbers.
    • Record results for two trials and calculate a mean average.
    • The mean average should be recorded to no more than one decimal place.

    Identifying sources of error

    Think carefully about your experiment, where might there have been an error? E.g. if you are looking at colour changes this is subjective and will be a source of error. Ensure you state the error and the reason it occurred.

    Describe how an element of a practical can be investigated.

    • Use five values.
    • State how these five values will be made, e.g. if the IV is concentration of enzyme, “use simple or serial dilution” or if it is temperature “use a thermostatically-controlled waterbath at 20°C, 30°C, 40°C, 50°C and 60°C”.

    Constructing graphs

    • You will normally use data that is given to you in the paper.
    • Put the IV on the x axis, DV on the y axis.
    • Use the full title from the table to label each axis, e.g. “initial rate of catalase activity / s-1“.
    • Always use units if appropriate (e.g. s or seconds but not sec).
    • Look at the values and use a logical scale. E.g. a scale of 0.06 or 0.04 for every large square of graph paper is not logical. However, a scale of 0.05 is logical.
    • Each plot will be checked to see whether it is accurate to within half a small square of the graph paper. It is recommended you use an x mark to do this.
    • There should be no labelling within the area of the graph.
    • Lines will be judged for their quality*.

    Bar graphs

    • Ensure lines are not too thick, as the quality of each one will be judged*.
    • Bars can be touching. However, if you chose to leave gaps the gaps must be evenly spaced.
    • The horizontal lines at the top must be perfectly straight, parallel to the x axis.

    Drawing diagrams

    • Quality of lines will be judged*.
    • No ruler straight lines for your diagram: nature is not straight!
    • No labels or writing within the drawing.
    • Label only what is asked of in the question.
    • Do not draw in anything that you do not see. E.g. smaller organelles.

    Plan diagrams

    • The diagram should be at least 60 mm wide at its greatest width.
    • There should be no shading.
    • There should be no cells in  plan diagram. Do not be tempted to draw them in!
    • Use the correct section of the slide. This will be in the instructions of the questions, but make sure you actually draw what it wants you to!

    Diagrams of cells

    • Cells should be at least 50 mm at their greatest width.
    • Draw exactly the number of cells stated in the question.
    • Do not include half cells. The questions always state “whole cells”.
    • Cells should not overlap but may be abutting (e.g. touching each other or sharing an outermost line).

    Calculations

    • Always show your working and the steps you take to come to your answer.
    • Always show units, but do not mix units. E.g. not 1 mm and 50 µm.
    • When converting units, show the conversion. E.g. 1 mm to µm: 1 x 1,000 = 1,000 µm.
    • Try not to go beyond one decimal place, or the same level of precision as is given in the question.
    • Give ratios to the lowest common denominator. E.g. 168:58 should be 84:29.

    Comparing observable differences using a table

    • Organise the table as three columns; one for the differences and two for the samples. E.g

    table-2

    • Underline the headings and divide the columns as per the table above.
    • If asked for differences, do not give similarities!
    • Differences would ideally be “X is thick” and “Y is thin”.

    *Quality of lines

    Each line you draw for a graph or drawing could be judged for its quality. E.g. whether it has been drawn by a sharp pencil as a thin and continuous line. This is really important as you don’t want to lose silly marks for not sharpening your pencil!

    wooden_pencil_sharpener

    Image by Asim18, CC BY 2.5, https://commons.wikimedia.org/w/index.php?curid=3129973